여성의 생애주기에 따른 자녀 수, 수면시간, 비만 간의 관계
요약
목적
출산 후 여성이 겪는 생리학적 변화들은 다양한 건강문제들이 발생하는 결과가 될 수 있다. 이 연구의 목표는 자녀 수, 수면시간, 그리고 비만 간의 관계를 한국 성인 여성의 생애주기에 따라 제시하는 것이다.
방법
이 연구에서는 2010-2012년까지 한국 국민건강영양조사에 참여한 10,081명을 연령에 따라 3개의 그룹(20-39, 40-64, 65세 이상)으로 세분화하여 분석하였다. 수면시간은 하루 평균 수면시간을 뜻하며, 비만은 체질량지수 ≥25 kg/m2으로 정의하였다. 자녀 수와 수면시간, 비만 간의 관계는 로지스틱 및 선형회귀분석을 통해 조사하였다.
결과
65세 미만의 여성의 수면시간은 자녀 수가 많을수록 감소하였다(그룹 1 [β]: −0.193, p <0.001; 그룹 2 [β]: −0.098, p <0.001). 비만의 교차비(odds)는 40세 이상 여성에서 자녀 수가 많을수록 증가하였다(그룹 2: 1.19 [1.10–1.29], p<0.001; 그룹 3: 1.08 [1.01–1.15], p =0.017). 40-64세까지 여성 중 자녀 수가 4명 이상인 경우, 비만의 교차비는 자녀가 없는 여성보다 1.92배 높았다(그룹 2: 1.92 [1.18–3.12], p for trend <0.001). 하지만 수면시간과 비만의 유의미한 관계는 어느 연령대에서도 확인할 수 없었다.
결론
한국 여성들에게 자녀 수와 수면시간 간의 부정적인 관계가 유의하게 나타났다. 또한, 자녀 수가 많은 여성은 비만의 위험이 증가하는 것을 관찰하였다.
핵심용어: 자녀 수, 수면시간, 비만, 짧은 수면, 임신
Abstract
Objectives
Physiological changes can be the result of various health problems in postpartum women. The aim of the present study is to address the relationships among parity, sleep duration, and obesity across the lifecycle of adult Korean women.
Methods
Our study analyzed data from 10,081 participants who provided responses to the Korean National Health and Nutrition Examination Survey from 2010 to 2012. We divided the data into sub-groups according to age (Group 1 [20–39 years], Group 2 [40–64 years], and Group 3 [≥65 years]), and parity (0, 1, 2, 3, and ≥4). We defined sleep duration as the average time spent sleeping per day. Obesity was defined as a body mass index (BMI) greater than 25.0 kg/m2. The relationships among parity, sleep duration, and obesity were investigated using logistic and linear regression analyses.
Results
Sleep duration in women younger than 65 years decreased with increased parity (Group 1 [β]: −0.170±0.050, p <0.001; Group 2 [β]: −0.093±0.027, p <0.001). The risk of obesity increased in women aged 40 years of age and older (Group 2 [odds ratio, OR]: 1.18 [95% confidence interval: 1.09-1.28], p <0.001; Group 3 [OR]: 1.09 (1.02-1.16), p =0.010). Obesity among women with parity ≥4 was 1.89-fold higher than that of nulliparous women in Group 2 (OR: 1.89 [1.16–3.06], p for trend <0.001). How-ever, sleep duration and obesity demonstrated no significant relationship in any age group.
Conclusions
Korean women were found to manifest a significant negative association between parity and sleep duration. Also, an increased risk of obesity was observed in women had more parity.
Key words: Parity, Sleep duration, Obesity, Short sleep, Pregnancy
INTRODUCTION
Parity may have a significant impact on the residual lifespans of women of reproductive age. The current trend in delayed childbearing has resulted in increased health concerns among women. Numerous studies have reported the physical and mental health challenges faced by women with high parity, such as general fatigue, depression [ 1], postpartum stress [ 2], altered sleep patterns [ 3], and weight gain [ 4]. Studies have investigated the physiological and psychological effects of increasing parity on women's health. Women bearing multiple children are exposed to these risks at an increased rate and require more time to recover. However, women have less time for both leisure [ 5] and sleep after bearing children [ 6]. Adequate sleep duration is essential to maintain good health. Sleep deprivation interferes with physiological activities such as cardiovascular regulation [ 7], pain sensitivity and recovery [ 8], and cognitive performance [ 9]. Multiparous women more experience various sleep problems than nulliparous women [ 10]. Women with high parity suffer from restless leg syndrome [ 11] and frequent sleep deprivation [ 12]. Therefore, they manifest poor health conditions, such as physical and mental dis-tress, activity limitations, depression, anxiety, and pain [ 13] due to insuf-ficient sleep time, which has a deteriorating effect on quality of life [ 14]. Short sleep duration are also a risk factor causing obesity [ 15]. The American Medical Association (AMA) has officially recognized obesity as a disease since 2013 [ 16]. According to AMA, obesity is a metabolic and hormonal disease with multifactorial etiology, which may result in fatal outcomes such as premature death [ 17] and diseases including diabetes, cardiovascular disease, and cancer [ 18, 19]. Multiparous women had more visceral obesity as compared with nulliparous or women with 1-2 children [ 20]. Women with obesity are at high risk of the morbidity including diabetes, coronary heart disease, and endometrial cancer [ 21]. The distinct pathophysiology of obesity and its management are attributed to biological and psychological differences in women [ 22]. Parity induces physiological and psychological changes, and health-related problems. However, studies investigating the relationship of obesity with high parity is limited to menopausal or postmenopausal women [ 23]. No studies analyzed the relationship between parity and sleep duration over the lifecycle of women. Therefore, we hypothesized that parity was associated with sleep duration and obesity over the lifecycle of Korean women. In the basis of the effects of women's aging and their children's age or school-age, we specifically hypothesized that the relationship between parity, sleep duration, and obesity would vary across lifecycle phases of them.
METHODS
Study population
We used data obtained from the Korea National Health and Nutrition Examination Survey (KNHANES) from 2010-2012, which was conducted by the Division of Chronic Disease Surveillance under the Korea Centers for Disease Control and Prevention since 1998. KNHANES is a nationwide survey designed to assess health-related factors such as health conditions, personal behaviors, and nutritional levels of Koreans. The survey is based on health interviews, and involves a nutritional survey along with health examinations carried out by professionally trained personnel. Data were based on household interviews and direct standardized physical examinations which were performed at specially equipped mobile examination centers. The sample included 19,394 participants aged above 20 years, including 11,016 women. We analyzed a final sample of 10,081 participants after excluding 935 subjects who failed to complete the survey or physical examination. The Institutional Review Board of the University of Seoul approved exemption of the ethi-cal review (IRB No. 2020-02).
Covariates
The participants’ clinical and demographic characteristics such as age, education, income, employment, marriage, smoking, drinking, oral contraceptive use, regular exercise, parity, and sleep duration were collected via a health interview. Parity was defined as the number of childbirth experiences, and was subdivided into five groups (0, 1, 2, 3, and ≥4 child-births). High parity was defined as the number of 4 or more childbirths. Sleep duration was estimated based on the answer to a single question: “How many hours do you usually sleep in a day on average?”. We then categorized the following variables in each analysis: education (≤below middle school, high school, or beyond college), income (low, middle low, middle high, or high), employment status (employed or unemployed), marital status (married and cohabiting or not), history of smoking (current smoker or ex-smoker and nonsmoker), alcohol consumption (current drinker or nondrinker), oral contraceptive use (ever or never), regular exercise (≥3 times per week or not). Body mass index (BMI) was calculated by the formula: weight (kg)/height (m 2). Obesity was defined as BMI ≥25.0 kg/m 2 [ 24].
Statistical analyses
Participants were aggregated into three age groups according to their age (20-39, 40-64, and ≥65 years) and analyzed. We examined linear trends of basic characteristics according to increasing age through linear regression analysis or Cochran-Amitage trend test. We also used the Chi-squared test for some categorical variables containing three or more categories.
First, we presented the mean sleep duration and prevalence of obesity according to parity, and then examined linear trends. We performed linear regression analysis and obtained least-squares means (LS means) of sleep duration according to parity (0, 1, 2, 3, and ≥4) in each age group. To control potential confounders, we adjusted for age only in model 1, further adjusted for education, income, employment, marriage, smoking, drinking, oral contraceptive use, and regular exercise in model 2, and further adjusted for obesity in model 3. We then performed logistic regression analysis with the same adjustments for obesity according to parity in each age group. However, we adjusted for sleep duration, instead of obesity, in model 3. Lastly, we examined the relationships between parity as a continuous variable, sleep duration, and obesity in each age group using linear regression analysis.
We performed these statistical analyses using the SAS survey procedure (version 9.4; SAS Institute Inc., Cary, NC, USA). A p value <0.05 was considered significant statistically.
RESULTS
Table 1 presents the general characteristics of the study population strat-ified into three age groups. The mean age of participants was 50.6 years, and the average sleep duration was 6.7 hours. The older women were likely to have more children, in addition to being sleep less, and highly obese ( p for trend <0.001).
Table 1
Basic characteristics of study participants according to age groups
|
Variables |
Age group (y) |
p for trend |
|
20-39 |
40-64 |
≥65 |
|
n |
3,026 |
4,640 |
2,415 |
|
|
Age (y) |
30.2 ± 0.1 |
50.7 ± 0.1 |
72.9 ± 0.1 |
< 0.001 |
|
Education (%) |
< 0.001* |
|
Below elementary school |
0.7 ± 0.2 |
24.9 ± 0.9 |
85.3 ± 0.9 |
|
|
Middle school |
2.0 ± 0.4 |
17.7 ± 0.7 |
7.6 ± 0.6 |
|
|
High school |
43.4 ± 1.2 |
38.5 ± 1.0 |
5.9 ± 0.6 |
|
|
Beyond college |
53.9 ± 1.2 |
18.8 ± 0.9 |
1.2 ± 0.2 |
|
|
Employed (%) |
52.4 ± 1.1 |
58.8 ± 0.9 |
27.5 ± 1.3 |
< 0.001 |
|
Income (%) |
0.950* |
|
Low |
27.9 ± 1.1 |
26.8 ± 0.9 |
26.6 ± 1.2 |
|
|
Middle-low |
25.7 ± 0.9 |
26.0 ± 0.8 |
26.7 ± 1.2 |
|
|
Middle-high |
24.2 ± 1.1 |
24.9 ± 0.8 |
24.3 ± 1.0 |
|
|
High |
22.2 ± 1.0 |
22.4 ± 0.8 |
22.4 ± 1.1 |
|
|
Married (%) |
55.3 ± 1.4 |
86.1 ± 0.7 |
44.8 ± 1.4 |
< 0.001 |
|
Smoker (%) |
9.4 ± 0.8 |
5.3 ± 0.5 |
3.8 ± 0.5 |
< 0.001 |
|
Drinker (%) |
52.5 ± 1.2 |
39.1 ± 0.9 |
17.7 ± 0.9 |
< 0.001 |
|
Oral contraceptive use (%) |
8.0 ± 0.6 |
15.3 ± 0.6 |
23.8 ± 1.1 |
< 0.001 |
|
Regular exercise (%) |
16.5 ± 0.9 |
18.7 ± 0.8 |
15.1 ± 1.1 |
0.017 |
|
Sleep duration (hr) |
7.2 ± 0.0 |
6.7 ± 0.0 |
6.2 ± 0.0 |
< 0.001 |
|
BMI (kg/m2) |
22.1 ± 0.1 |
24.0 ± 0.1 |
24.3 ± 0.1 |
< 0.001 |
|
Obesity (%) |
18.6 ± 1.0 |
33.2 ± 0.8 |
38.0 ± 1.2 |
< 0.001 |
|
Parity (n) |
1.0 ± 0.0 |
2.3 ± 0.0 |
4.3 ± 0.1 |
< 0.001 |
Women with high parity slept for fewer hours and showed an increased risk of obesity in some age groups ( Figure 1). LS means of sleep duration showed a decreasing trend with increasing parity in women aged 20 to 64 years (age group 1 [ p for trend]: 0.002; age group 2 [ p for trend]: 0.011) ( Table 2). The risk of obesity was significantly increased with higher parity in those aged 40 to 64 years ( p for trend <0.001) ( Table 3). Compared with non-parous women, the obesity in women with parity ≥4 was 1.89-fold higher in the age group 2 (odds ratio [OR]: 1.89 [95% confidence in-terval: 1.16-3.06], p for trend <0.001). No significant relationship existed between parity and obesity in the age group of 20 to 39 after adjustment ( Table 3).
Table 2
Least-squares means of sleep duration according to the parity level
|
Variables |
Parity
|
p for trend |
|
0 (n = 1,431) |
1 (n = 1,096) |
2 (n = 3,710) |
3 (n = 1,775) |
≥4 (n = 2,069) |
|
Sleep duration (h) |
|
Age (y) |
|
20-39 |
|
n |
1,224 |
558 |
988 |
221 |
35 |
|
|
Model 1 |
7.15 ± 0.05 |
7.41 ± 0.08 |
7.20 ± 0.06 |
7.13 ± 0.11 |
6.85 ± 0.39 |
0.650 |
|
Model 2 |
7.48 ± 0.08 |
7.19 ± 0.08 |
6.99 ± 0.06 |
6.90 ± 0.12 |
6.71 ± 0.39 |
<0.001 |
|
Model 3 |
7.47 ± 0.08 |
7.19 ± 0.08 |
7.00 ± 0.06 |
6.91 ± 0.12 |
6.75 ± 0.39 |
0.002 |
|
40-64 |
|
n |
171 |
448 |
2,488 |
1,040 |
493 |
|
|
Model 1 |
6.91 ± 0.14 |
6.76 ± 0.09 |
6.70 ± 0.03 |
6.57 ± 0.05 |
6.58 ± 0.09 |
0.008 |
|
Model 2 |
7.01 ± 0.14 |
6.80 ± 0.09 |
6.70 ± 0.03 |
6.56 ± 0.05 |
6.58 ± 0.09 |
0.001 |
|
Model 3 |
7.01 ± 0.14 |
6.80 ± 0.09 |
6.70 ± 0.03 |
6.56 ± 0.05 |
6.59 ± 0.09 |
0.011 |
|
≥65 |
|
n |
36 |
90 |
234 |
514 |
1,541 |
|
|
Model 1 |
6.26 ± 0.27 |
6.61 ± 0.19 |
6.24 ± 0.12 |
6.21 ± 0.09 |
6.23 ± 0.06 |
0.500 |
|
Model 2 |
6.27 ± 0.27 |
6.59 ± 0.20 |
6.17 ± 0.12 |
6.21 ± 0.08 |
6.24 ± 0.06 |
0.590 |
|
Model 3 |
6.27 ± 0.27 |
6.58 ± 0.19 |
6.16 ± 0.12 |
6.20 ± 0.08 |
6.24 ± 0.06 |
0.420 |
Table 3
The risk of obesity according to parity level
|
Variables |
Parity
|
p for trend |
|
0 (n = 1,431) |
1 (n = 1,096) |
2 (n = 3,710) |
3 (n = 1,775) |
≥4 (n = 2,069) |
|
Obesity |
|
Age (y) |
|
20-39 |
|
n |
1,224 |
558 |
988 |
221 |
35 |
|
|
Model 1 |
1.00 (ref.) |
1.29 (0.88-1.88) |
1.22 (0.85-1.76) |
1.71 (1.02-2.86) |
5.99 (2.51-14.27) |
0.004 |
|
Model 2 |
1.00 (ref.) |
0.85 (0.50-1.44) |
0.77 (0.45-1.30) |
0.97 (0.50-1.88) |
2.94 (1.06-8.15) |
0.400 |
|
Model 3 |
1.00 (ref.) |
0.83 (0.48-1.41) |
0.74 (0.43-1.27) |
0.93 (0.48-1.82) |
2.82 (0.98-8.11) |
0.470 |
|
40-64 |
|
n |
171 |
448 |
2,488 |
1,040 |
493 |
|
|
Model 1 |
1.00 (ref.) |
1.05 (0.64-1.72) |
1.24 (0.82-1.89) |
1.37 (0.87-2.17) |
2.40 (1.50-3.84) |
<0.001 |
|
Model 2 |
1.00 (ref.) |
0.99 (0.60-1.63) |
1.12 (0.72-1.73) |
1.20 (0.75-1.93) |
1.92 (1.18-3.12) |
<0.001 |
|
Model 3 |
1.00 (ref.) |
0.99 (0.60-1.62) |
1.14 (0.73-1.75) |
1.21 (0.76-1.94) |
1.89 (1.16-3.06) |
<0.001 |
|
≥65 |
|
n |
36 |
90 |
234 |
514 |
1,541 |
|
|
Model 1 |
1.00 (ref.) |
0.92 (0.36-2.37) |
0.82 (0.35-1.89) |
1.08 (0.48-2.41) |
1.09 (0.50-2.40) |
0.220 |
|
Model 2 |
1.00 (ref.) |
0.89 (0.35-2.25) |
0.84 (0.36-1.93) |
1.00 (0.44-2.26) |
1.06 (0.48-2.33) |
0.300 |
|
Model 3 |
1.00 (ref.) |
0.87 (0.34-2.21) |
0.81 (0.35-1.88) |
0.99 (0.44-2.24) |
1.06 (0.48-2.33) |
0.230 |
Figure 1
The mean values of sleep duration and obesity according to parity. (A) sleep duration (p for trend in age 20-39: 0.001, 40-64: 0.002, .65: 0.40), (B) the prevalence of obesity (p for trend in age 20-39: <0.001, 40-64: <0.001, ≥65: 0.98). Error bars indicate SE. 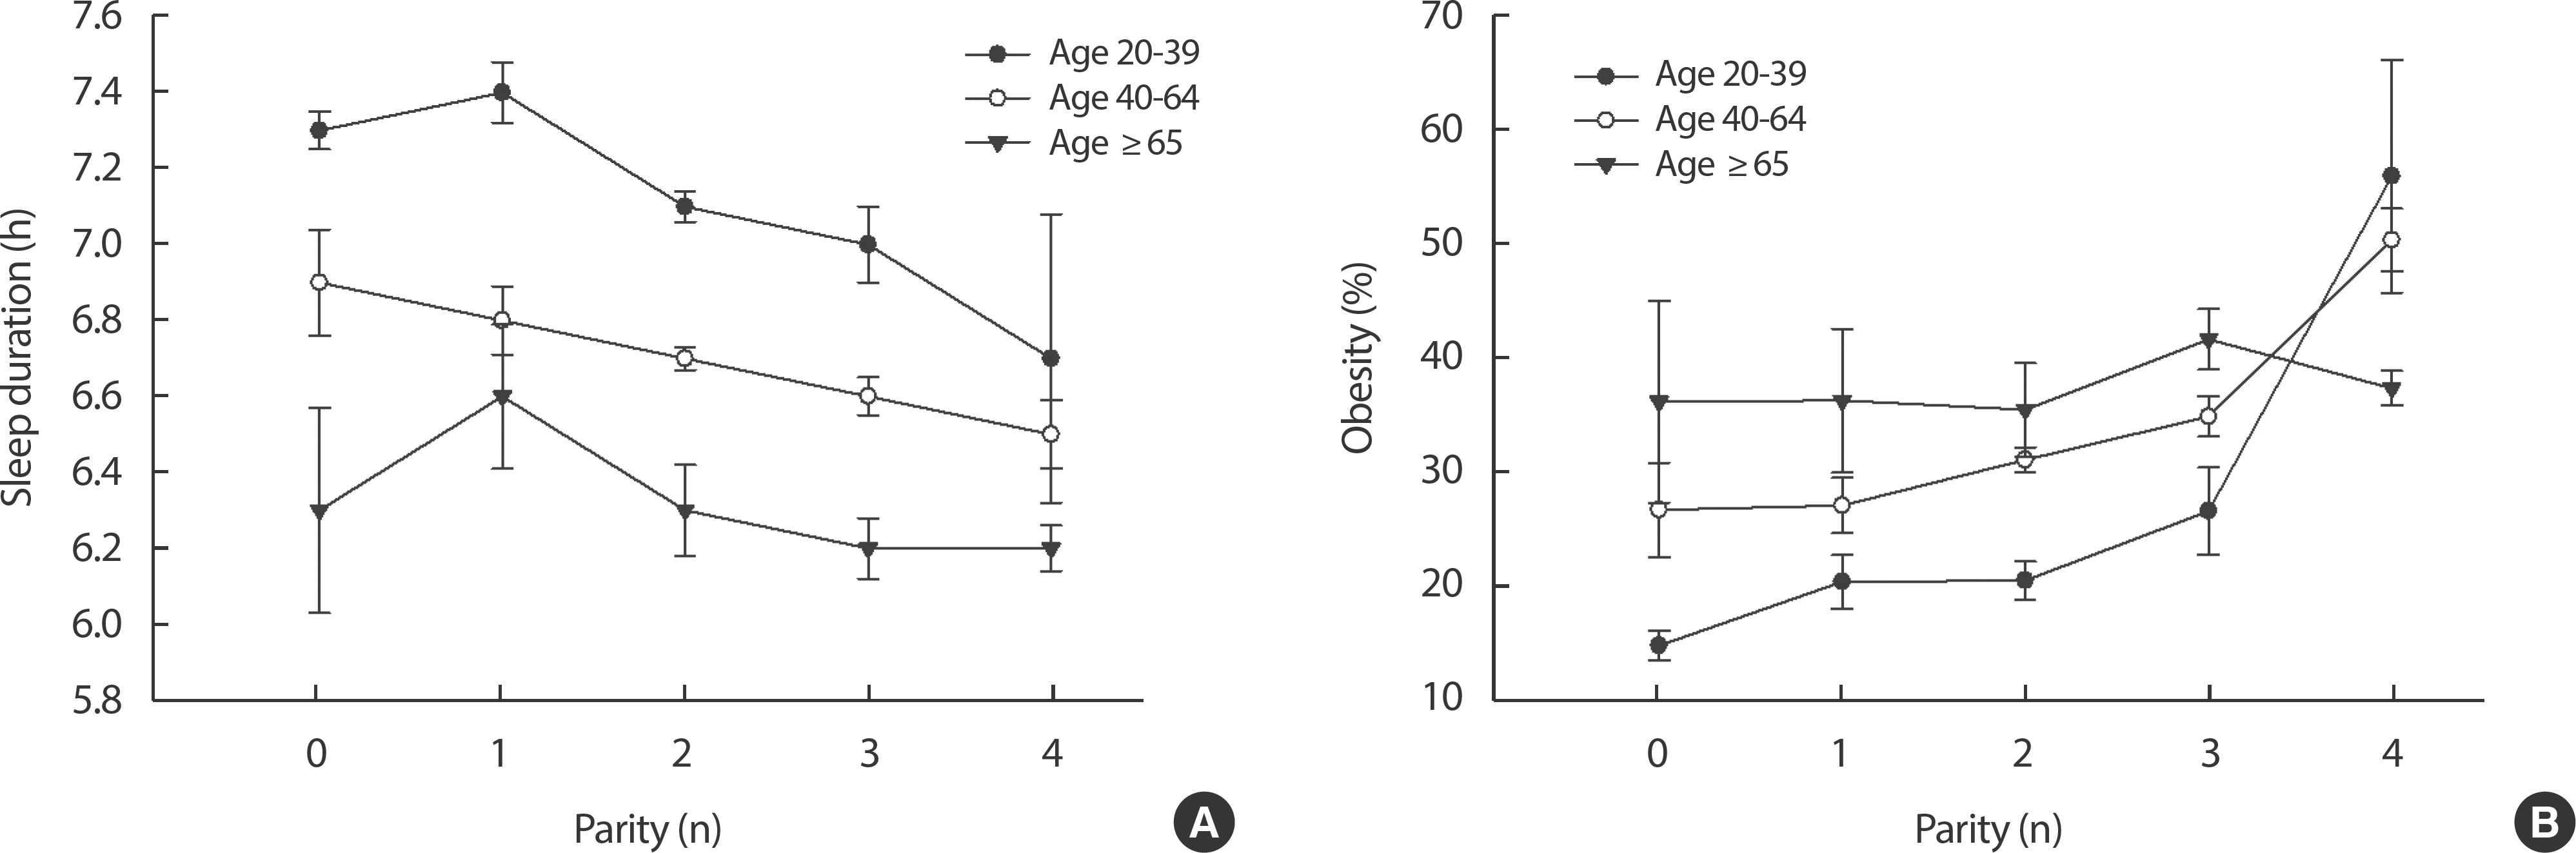
Increased one parity led to a decrease in sleep duration by 10 and 6 minutes in women aged 20 to 39 years and 40 to 64 years, respectively (age group 1 [β]: −0.170±0.050, p <0.001; age group 2 [β]: −0.093±0.027, p <0.001] ( Table 4). The risk of obesity was also significantly increased 9% to 18% when one parity increased in women aged above 40 years (age group 2 [OR]: 1.18 [1.09–1.28], p <0.001; age group 3 [OR]: 1.09 [1.02–1.16], p =0.010).
Table 4
The risk of obesity according to parity and sleep duration
|
Variables |
Sleep duration
|
Obesity
|
|
Coefficient (β) |
p
|
OR (95% CI) |
p
|
|
Age (y) |
|
20-39 (n=3,026) |
|
Model 1 |
−0.022 ± 0.008 |
0.590 |
1.24 (1.07-1.44) |
0.004 |
|
Model 2 |
−0.193 ± 0.052 |
<0.001 |
1.09 (0.91-1.32) |
0.360 |
|
Model 3 |
−0.170 ± 0.050 |
<0.001 |
1.08 (0.89-1.31) |
0.430 |
|
40-64 (n=4,640) |
|
Model 1 |
−0.083 ± 0.028 |
0.003 |
1.23 (1.14-1.33) |
< 0.001 |
|
Model 2 |
−0.098 ± 0.027 |
<0.001 |
1.19 (1.10-1.29) |
< 0.001 |
|
Model 3 |
−0.093 ± 0.027 |
<0.001 |
1.18 (1.09-1.28) |
< 0.001 |
|
≥65 (n = 2,415) |
|
Model 1 |
−0.010 ± 0.024 |
0.670 |
1.07 (1.01-1.14) |
0.022 |
|
Model 2 |
−0.006 ± 0.024 |
0.790 |
1.08 (1.01-1.15) |
0.017 |
|
Model 3 |
−0.005 ± 0.024 |
0.830 |
1.09 (1.02-1.16) |
0.010 |
DISCUSSION
This study was performed to examine the relationship between parity, sleep duration, and obesity across the lifecycle of adult Korean women. As parity increased, the sleep duration of women aged below 65 years decreased. Also, the obesity level was higher among women aged above 40 years and with high parity. There was no significant relationship between sleep duration and obesity.
Sleep duration decreased as parity increased in the group below 65 years. Parity is deeply associated with repeated reproductive stages such as pregnancy and delivery. Previous studies reported that the fluctuation in sex hormones, especially progesterone, has a negative association with sleep in women [ 25]. In a recent German study, women slept for 41 minutes less daily after their first childbirth [ 6]. Moreover, the time required for women to fall sleep could be attributed to frequent responses to their children, household chores, and the burden associated with childbirth [ 26]. However, sleep duration was not decreased in women with high parity in the age group above 65 years, implying that older women who have independent children are less likely to have mental stress and sleep disorder symptoms [ 27]. In our study, as parity increased, the risk of obesity increased in women aged above 40 years, which was consistent with a previous study showing that the risk of obesity in women increases by 7% as the number of births increase [ 28]. Other studies also reported the relationship between parity and obesity, but the underlying mechanisms are complicated and remain unclear. About 75% of women were overweight because of higher weight retention after childbirth [ 29]. Additionally, the women were exposed to increased stress [ 30] and decreased physical activity [ 31] due to childbearing. Especially, less physical activities are associated with obesity and increased age of women [ 32]. Middle-aged women have less muscle and basal metabolism due to reduced levels of somatotrophic hormone [ 33]. Thus, the severity of obesity is higher in women aged above 40 years. In the additional analysis, sleep duration was not associated with obesity in any age group (data not shown). A variety of studies showed that sleep deprivation may induce leptin loss [ 34] and ghrelin elevation [ 35], which are risk factors for obesity by stimulating fat synthesis in the body. Additionally, the efficiency of the body to burn calories is decreased due to sleep deprivation [ 36]. Kohatsu et al. [ 37] showed that short sleep duration was associated with higher BMI in rural American population. The BMI of Norwegians in their 40s who slept for less than 6 hours was increased [ 38]. However, the significance of this relationship was not found in our additional analysis. Discrepancies between this and previous study results on the relationship between sleep duration and obesity should be elucidated through further studies. This is the first study to provide evidence supporting the relationship between parity and sleep duration. Another strength of this study was that we used a representative population-based survey data, KNHANES, to test our hypothesis. However, this data might include potential recall bias and misclassification based on individual answers. Especially, in our survey, parity did not include various possibilities such as stillbirth or infant death. This study is cross-sectional, so a prospective cohort study is required to establish a cause-effect relationship. Another limitation of this study was that our hypothesis was tested using participants’ data surveyed a decade ago, KNHANES 2010-2013, because KNHANES have surveyed the number of pregnancies instead of the number of childbirths since 2014. Lastly, generalization of our results to recent women of child-bearing age should be cautious, because the number of deliveries steadily declined from 4.53 fertility rate in 1970 to 0.92 in 2019 [ 41].
CONCLUSION
Increased parity in Korean women was negatively associated with sleep duration. In addition, the risk of obesity is increased with higher parity. Additional studies are needed to elucidate the mechanisms of adverse health outcomes with parity. Our study suggests that women who deliv-ered many children should be carefully monitored with interest in their sleep duration at the age of 20-64 years and obesity at 40 years or later.
REFERENCES
1. Wilson N, Lee JJ, Bei B. Postpartum fatigue and depression: a systematic review and meta-analysis. J Affect Disord 2019;246:224-233. DOI: 10.1016/j.jad.2018.12.032.  2. Clout D, Brown R. Sociodemographic, pregnancy, obstetric, and postnatal predictors of postpartum stress, anxiety and depression in new mothers. J Affect Disord 2015;188:60-67. DOI: 10.1016/j.jad.2015.08. 054. 3. Lee KA, Zaffke ME, McEnany G. Parity and sleep patterns during and after pregnancy. Obstet Gynecol 2000;95(1):14-18. DOI: 10.1016/s0029-7844(99)00486-x. 4. Li W, Wang Y, Shen L, Song L, Li H, Liu B, et al. Association between parity and obesity patterns in a middle-aged and older Chinese population: a cross-sectional analysis in the Tongji-Dongfeng cohort study. Nutr Metab (Lond) 2016;13:72. DOI: 10.1186/s12986-016-0133-7. 5. Thrane C. Men, women, and leisure time: Scandinavian evidence of gender inequality. Leisure Sciences 2000;22(2):109-122. DOI: 10.1080/014904000272885. 6. Richter D, Kramer MD, Tang NKY, Montgomery-Downs HE, Lemola S. Long-term effects of pregnancy and childbirth on sleep satisfaction and duration of first-time and experienced mothers and fathers. Sleep 2019;42(4):zsz015. DOI: 10.1093/sleep/zsz015. 7. Tobaldini E, Pecis M, Montano N. Effects of acute and chronic sleep deprivation on cardiovascular regulation. Arch Ital Biol 2014;152(2-3):103-110. DOI: 10.12871/000298292014235.
8. Roehrs TA, Harris E, Randall S, Roth T. Pain sensitivity and recovery from mild chronic sleep loss. Sleep 2012;35(12):1667-1672. DOI: 10. 5665/sleep.2240. 9. Philip P, Sagaspe P, Prague M, Tassi P, Capelli A, Bioulac B, et al. Acute versus chronic partial sleep deprivation in middle-aged people: differential effect on performance and sleepiness. Sleep 2012;35(7):997-1002. DOI: 10.5665/sleep.1968. 10. Christian LM, Carroll JE, Porter K, Hall MH. Sleep quality across pregnancy and postpartum: effects of parity and race. Sleep Health 2019;5(4):327-334. DOI: 10.1016/j.sleh.2019.03.005. 11. Berger K, Luedemann J, Trenkwalder C, John U, Kessler C. Sex and the risk of restless legs syndrome in the general population. Arch Intern Med 2004;164(2):196-202. DOI: 10.1001/archinte.164.2.196. 12. Mallampalli MP, Carter CL. Exploring sex and gender differences in sleep health: a Society for Women's Health Research Report. J Womens Health (Larchmt) 2014;23(7):553-662. DOI: 10.1089/jwh.2014.4816. 13. Strine TW, Chapman DP. Associations of frequent sleep insufficiency with health-related quality of life and health behaviors. Sleep Med 2005;6(1):23-27. DOI: 10.1016/j.sleep.2004.06.003. 14. Zeitlhofer J, Schmeiser-Rieder A, Tribl G, Rosenberger A, Bolitschek J, Kapfhammer G, et al. Sleep and quality of life in the Austrian population. Acta Neurol Scand 2000;102(4):249-257. DOI: 10.1034/j.1600-0404.2000.102004249.x. 15. Zhou Q, Zhang M, Hu D. Dose-response association between sleep duration and obesity risk: a systematic review and meta-analysis of prospective cohort studies. Sleep Breath 2019;23(4):1035-1045. DOI: 10.1007/s11325-019-01824-4. 16. Association AM. Resolution 420 (A-13): recognition of obesity as a disease. Proceedings of the House of Delegates 162nd Annual Meeting. 2013.
17. Adams KF, Schatzkin A, Harris TB, Kipnis V, Mouw T, Ballard-Barbash R, et al. Overweight, obesity, and mortality in a large prospective cohort of persons 50 to 71 years old. N Engl J Med 2006;355(8):763-778. DOI: 10.1056/NEJMoa055643. 18. Aballay LR, Eynard AR, Díaz MdP, Navarro A, Muñoz SE. Overweight and obesity: a review of their relationship to metabolic syndrome, cardiovascular disease, and cancer in South America. Nutr Rev 2013;71(3):168-179. DOI: 10.1111/j.1753-4887.2012.00533.x. 19. Mathes WF, Kelly SA, Pomp D. Advances in comparative genetics: influence of genetics on obesity. Br J Nutr 2011;106(Suppl 1):S1-10. DOI: 10.1017/S0007114511001905. 20. Luoto R, Männistö S, Raitanen J. Ten-year change in the association between obesity and parity: results from the National FINRISK Population Study. Gend Med 2011;8(6):399-406. DOI: 10.1016/j.genm.2011. 11.003. 21. Jung RT. Obesity as a disease. Br Med Bull 1997;53(2):307-321. DOI: 10.1093/oxfordjournals.bmb.a011615. 22. Rolls BJ, Fedoroff IC, Guthrie JF. Gender differences in eating behavior and body weight regulation. Health Psychol 1991;10(2):133-142. DOI: 10.1037//0278-6133.10.2.133. 23. Chedraui P, San Miguel G, Villacreses D, Dominguez A, Jaramillo W, Escobar GS, et al. Assessment of insomnia and related risk factors in postmenopausal women screened for the metabolic syndrome. Maturitas 2013;74(2):154-159. DOI: 10.1016/j.maturitas.2012.10.017. 24. Oh SW, Shin SA, Yun YH, Yoo T, Huh BY. Cut-off point of BMI and obesity-related comorbidities and mortality in middle-aged Koreans. Obes Res 2004;12(12):2031-2040. DOI: 10.1038/oby.2004.254. 25. Lee KA, Shaver JF, Giblin EC, Woods NF. Sleep patterns related to menstrual cycle phase and premenstrual affective symptoms. Sleep 1990;13(5):403-409.
26. Moon H, Jun J. Scattered Sleep: Analysis of Postpartum Mother's Sleep and its Implication. Fam Culture 2017;29(4):1-26. (Korean). 27. Asplund R. Sleep disorders in the elderly. Drugs Aging 1999;14(2):91-103. DOI: 10.2165/00002512-199914020-00002. 28. Weng HH, Bastian LA, Taylor DH Jr., Moser BK, Ostbye T. Number of children associated with obesity in middle-aged women and men: results from the health and retirement study. J Womens Health (Larchmt) 2004;13(1):85-91. DOI: 10.1089/154099904322836492. 29. Endres LK, Straub H, McKinney C, Plunkett B, Minkovitz CS, Schetter CD, et al. Postpartum weight retention risk factors and relationship to obesity at 1 year. Obstet Gynecol 2015;125(1):144-152. DOI: 10. 1097/AOG.0000000000000565. 30. Davis EM, Stange KC, Horwitz RI. Childbearing, stress and obesity disparities in women: a public health perspective. Matern Child Health J 2012;16(1):109-118. DOI: 10.1007/s10995-010-0712-6. 31. Pereira MA, Rifas-Shiman SL, Kleinman KP, Rich-Edwards JW, Peterson KE, Gillman MW. Predictors of change in physical activity during and after pregnancy: Project Viva. Am J Prev Med 2007;32(4):312-319. DOI: 10.1016/j.amepre.2006.12.017. 32. Hunter SK, Thompson MW, Adams RD. Relationships among age-associated strength changes and physical activity level, limb dominance, and muscle group in women. J Gerontol A Biol Sci Med Sci 2000;55(6):B264-273. DOI: 10.1093/gerona/55.6.b264. 33. de Boer H, Blok GJ, Van der Veen EA. Clinical aspects of growth hormone deficiency in adults. Endocr Rev 1995;16(1):63-86. DOI: 10.1210/edrv-16-1-63. 34. Spiegel K, Leproult R, L'Hermite-Baleriaux M, Copinschi G, Penev PD, Van Cauter E. Leptin levels are dependent on sleep duration: relationships with sympathovagal balance, carbohydrate regulation, cortisol, and thyrotropin. J Clin Endocrinol Metab 2004;89(11):5762-5771. DOI: 10.1210/jc.2004-1003. 35. van der Lely AJ, Tschop M, Heiman ML, Ghigo E. Biological, physiological, pathophysiological, and pharmacological aspects of ghrelin. Endocr Rev 2004;25(3):426-457. DOI: 10.1210/er.2002-0029. 36. Benedict C, Hallschmid M, Lassen A, Mahnke C, Schultes B, Schiöth HB, et al. Acute sleep deprivation reduces energy expenditure in healthy men. Am J Clin Nutr 2011;93(6):1229-1236. DOI: 10.3945/ajcn.110. 006460. 37. Kohatsu ND, Tsai R, Young T, VanGilder R, Burmeister LF, Stromquist AM, et al. Sleep duration and body mass index in a rural population. Arch Intern Med 2006;166(16):1701-1705. DOI: 10.1001/archinte.166. 16.1701. 38. BJORVATN B, Sagen IM, ØYANE N, Waage S, Fetveit A, PALLESEN S, et al. The association between sleep duration, body mass index and metabolic measures in the Hordaland Health Study. J Sleep Res 2007;16(1):66-76. DOI: 10.1111/j.1365-2869.2007.00569.x. 39. Vézina-Im L, Lebel A, Gagnon P, Nicklas TA, Baranowski T. Association between sleep and overweight/obesity among women of childbearing age in Canada. Can J Public Health 2018;109(4):516-526. DOI: 10.17269/s41997-018-0071-4. 40. Zhou Q, Wu X, Zhang D, Liu L, Wang J, Cheng R, et al. Age and sex differences in the association between sleep duration and general and abdominal obesity at 6-year follow-up: the rural Chinese cohort study. Sleep Med 2020;69:71-77. DOI: 10.1016/j.sleep.2019.12.025.
|
|